Key Performance Indicators, or KPIs, are imperative in all areas of marketing, especially Social Media when the ROI (return on investment) is harder to track.
KPIs are a quantifiable measure of performance over a set period and help businesses identify targets to work towards. Monitoring KPIs will assist businesses in reviewing their progress, meeting important milestones and making better decisions for the future.
With so much data and metrics available across Social Media platforms, businesses need to identify which figures are most relevant to them. There are three important areas that brands should be monitoring when it comes to Social Media: Reach, Engagement and, of course, Conversions.
These three KPIs will help businesses understand whether they are getting in front of the right audiences, who are actively engaging and converting to customers. This insight will help support the Social Media strategy and highlight any changes that may be needed.
SMART KPIs
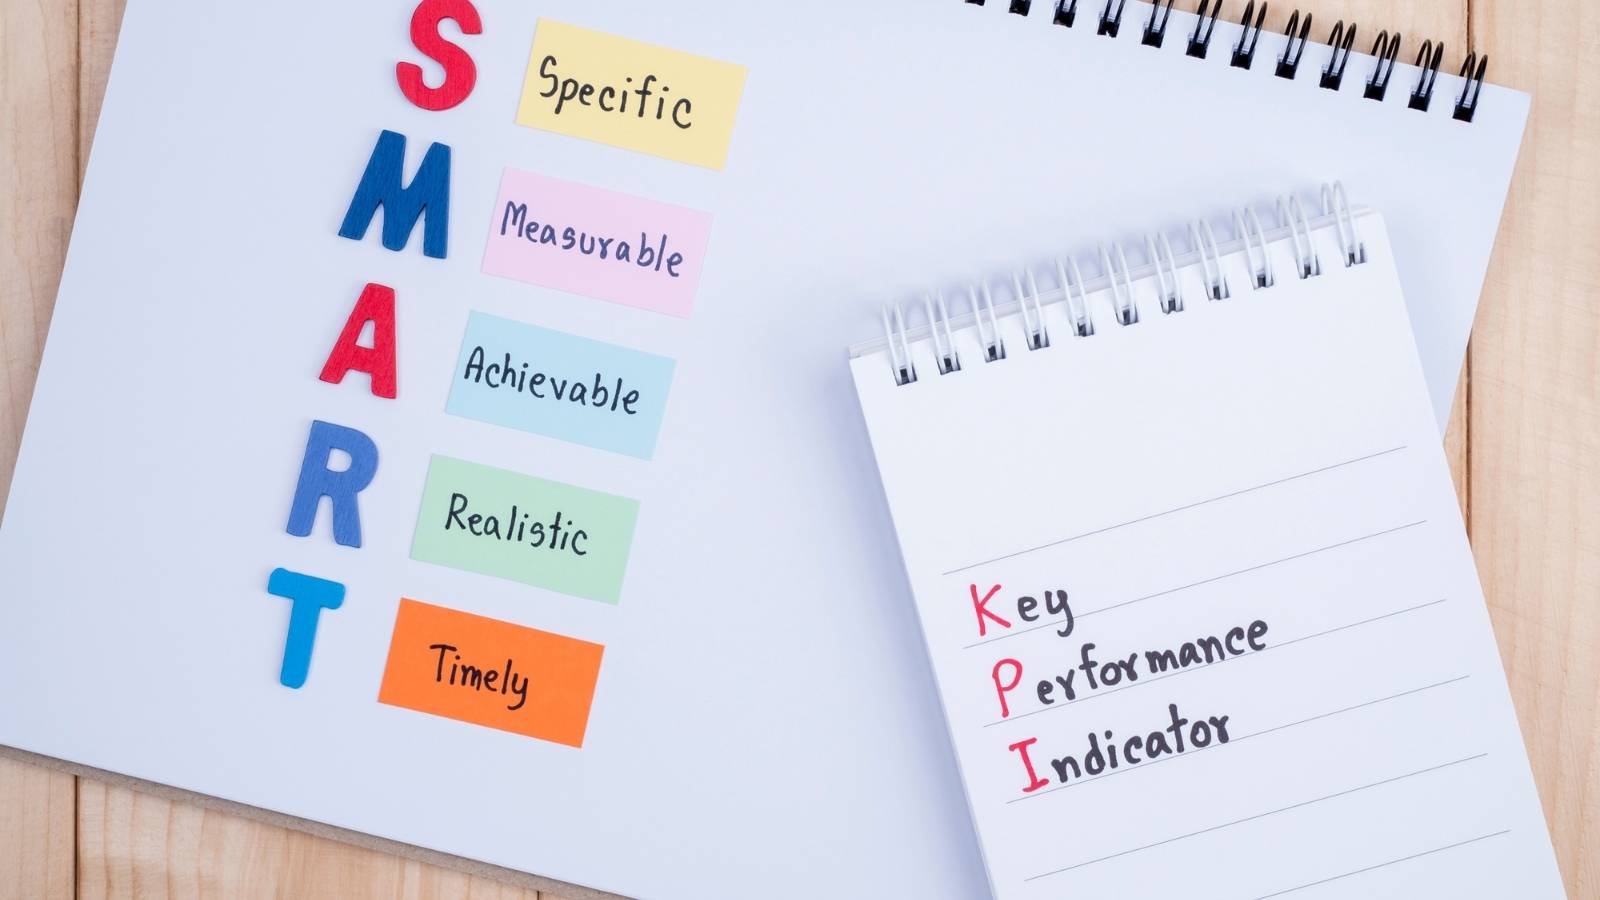
Any Social Media KPIs should be SMART: Specific, Measurable, Attainable, Relevant and Timely.
Specific – Take a look at your business and marketing objectives to understand how Social Media can be best utilised. Then, outline your goals and KPIs as clear and specific as possible.
Measurable – You must be able to track your progress to understand if you’re reaching your goals or how far off you are.
Attainable – Goals and KPIs must be realistic otherwise you won’t reach them and Social Media will be deemed as a waste of time and resources.
Relevant – As above, your KPIs should mirror wider business targets.
Timely – Without a clear and attainable timeframe, you’re unlikely to be as motivated to reach your goals.
How To Outline Social Media KPIs
KPIs are an ongoing task as your business, and therefore Social Media strategy grows and evolves. Some businesses may even choose to set KPIs for each individual marketing campaign.
You will need to start by understanding the KPIs objective, and how it will support the business in reaching a specific goal. Next, consider what metric(s) are required for tracking.
For example, if the overall business goal is to reach a larger conquest audience, then your objective would be to drive awareness on Social Media. The key metrics here would be Reach and Impressions.
Set a schedule for how often you will be reviewing the KPIs, for example, weekly, monthly or quarterly. This will help you track a pattern of (hopefully) growth and quickly identify anything that isn’t working.
It may be that you need to review each KPI to ensure they’re still relevant and supporting the businesses goals. You must work closely with wider teams, not just the Social Media or marketing departments to understand what these are.
Reach
Reach is the number of Social Media users who have seen your post or Ad since it went live. Of course, your reach will vary depending on factors including the day or time of your post, the content (i.e. Video or Static Image) and several other algorithm-dependant reasons.
It’s important to note here that Reach is a quantitative measure for potential audience exposure, growth and brand awareness.
Reach KPIs
One of the easiest ways to calculate your Potential Organic Reach is to know how many followers you have on each platform. The reason we say potential is it’s unlikely you’ll reach 100% of your followers organically, but you should be able to monitor a pattern of average potential reach the more you post.
Potential reach is only one side of the coin, to determine your actual Reach Percentage, simply calculate:
Post Views / Total Followers x 100 = Post Reach Percentage
Impressions
Users may see posts, especially sponsored ones, more than once in their feed and therefore businesses will also likely monitor their Impressions, which is calculated by:
Total Reach x Frequency = Impressions
Audience Growth
To monitor your audience growth, a key implication is that you’re reaching the right audience, it’s important to track how your follower figure is changing for each platform. This is calculated by:
New Followers / Total Followers x 100 = Growth Rate Percentage
Engagement
A step up from Reach is Engagement, which is based on how many interactions a post receives from those who’ve viewed it. Engagement KPIs measure the quality of the interactions with your audience and therefore how likely you are to reach your objectives.
See how to calculate your engagement here
Engagement KPIs
Going back to the original hypothetical goal of reaching a larger conquest audience, by monitoring the engagement levels on your content, you will better understand whether you’re reaching the right users as they’re taking the time to actively Like, Comment, Share or Retweet (depending on the platform).
A good metric to track is your Average Engagement Rate, which is calculated by:
Total Engagement / Total Number of Followers = Average Engagement Rate
What’s more, the more engagement you receive on a post, the larger your organic Total Engagement / Total Number of Followers = Average Engagement Rate reach will be as their friends and family will see the content too. This is called the amplification rate, which is calculated by:
Total Post Shares / Total Followers x 100 = Amplification Rate Percentage
Conversions
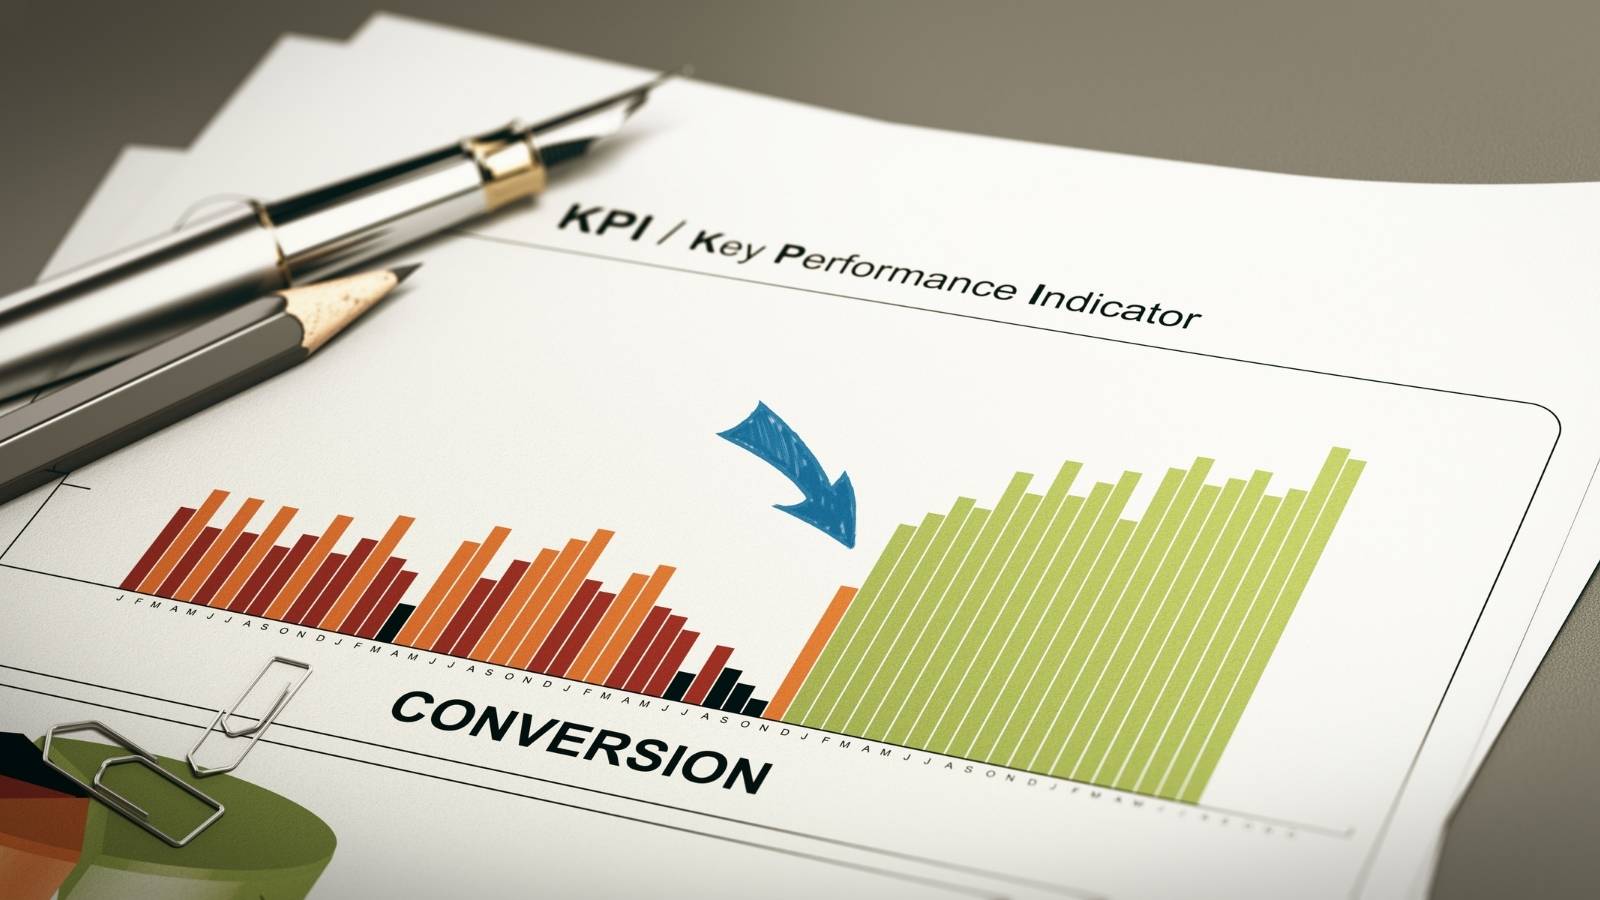
The piece de resistance of KPIs is of course conversions. Not only are conversion KPIs important to track across Social Media, but also your website.
A conversion on Social Media would most likely be a direct message to the platform enquiring about a product or service. These are normally less common because prospects will want to visit your website first to learn more about you.
Therefore, Conversion KPIs typically measure how many social interactions ‘convert’ into website visitors or other intended actions such as Lead Generation submissions or newsletter sign-ups for example.
Conversion KPIs
For an overview, your Conversion Rate Percentage will reveal how effective your Social Media strategy really is! This is calculated by:
Total Conversions / Total Clicks x 100 = Conversion Rate Percentage
However, you may find that your conversion rate is lower than expected so it’s worth tracking a few other metrics to find where they ‘drop off’.
For example, your Click-Through-Rate highlights how many people engaged with the content and clicked on a call to action (CTA) but didn’t necessarily convert.
Total Clicks / Total Impressions x 100 = Click-Through Rate
There are several reasons why a website visitor may ‘bounce’ off your site. Firstly, if a lot of your website traffic comes from mobile but you don’t have a mobile-responsive site this can be a huge deterrent. Secondly, if your site doesn’t match your Social Media content, in price or description, your visitors will likely become unengaged.
Each of these insights will help you understand if your Social Media is truly working for you and where you need to improve.
Efficiently Managing Social Media with Limited Time
Social media has become the lifeblood of businesses and individuals alike. It's a vibrant playground where connections are made, trends are born, and ideas are shared with lightning speed. Whether you're a small business owner, an aspiring influencer, or simply...
Streamlining Social Media for Recruiters : A Comprehensive Guide
Social media has seamlessly integrated into our daily lives, as millions of individuals flock to various platforms to connect with others, information sharing, and pursue new opportunities. Within today's competitive job market, utilizing the power of social media...


