The importance of mastering Social Media has grown over the last few years as more and more companies understand it’s a vital role in the marketing mix. With this competition inevitably comes more pressure to get it right. The only way to understand what return Social Media is bringing to your business is by tracking results.
Start by setting your Social Media goals, which should align nicely with your marketing goals. These goals can then be used to tailor your Social Media content and give you something to work towards. Your measurement of success will be to reach said goals.
Where is this information?
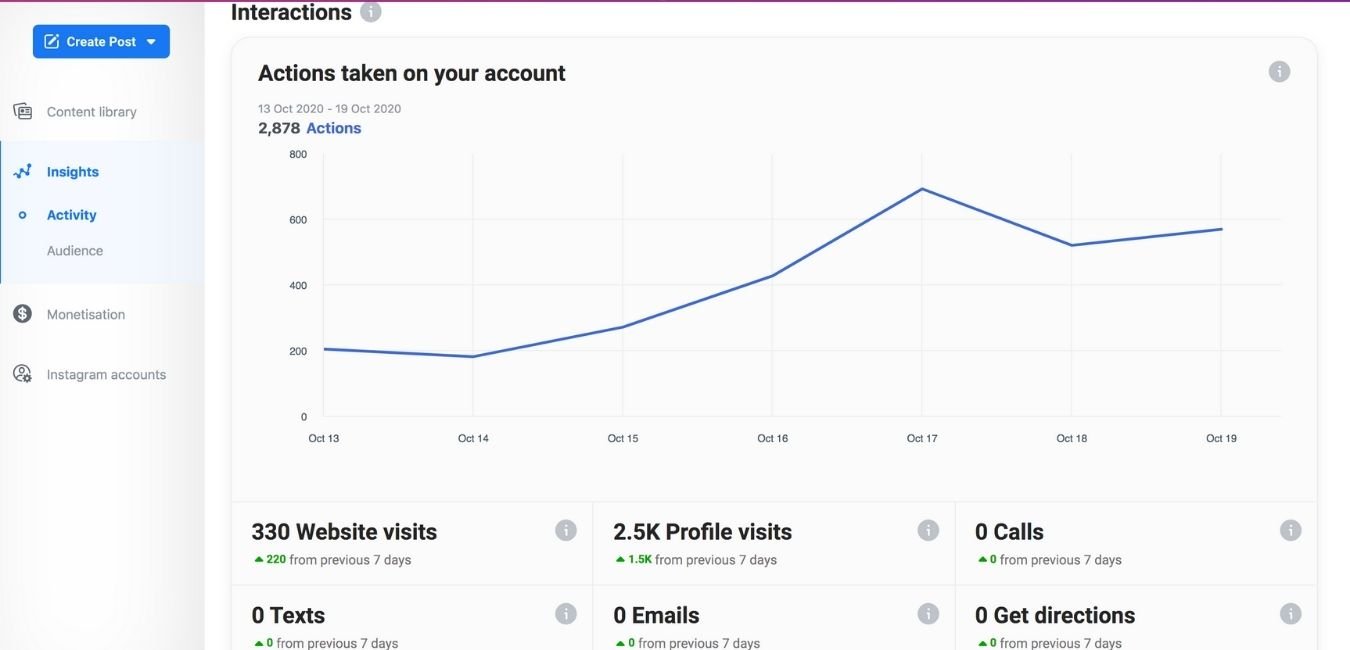
If you’re looking to measure the results of your Facebook posts, then go to your business page and ‘Insights’. Here you will see a page summary of the last twenty-eight days, seven days, yesterday or today. The primary metrics for your Facebook activity are:
- Actions On Page
- Page Views
- Page Previews
- Page Likes
- Post Reach
- Story Reach
- Recommendations
- Post Engagement
- Videos
- Page Followers
- Responsiveness

LinkedIn shows you the last thirty-day activity on the left-hand side of your page. You will be able to see:
- Unique Visitors
- New Followers
- Post Impressions
- Custom Button Clicks
You will also be able to see the percentage increase or decrease for the above.
If you are looking for more information, there is an Analytics section where you can see information about your Visitors, Updates and Followers. Analytics includes the number of Page Views, Reactions, Comments, Shares and information on your follower demographics.
It’s essential to know in advance that you can only see Instagram Insights if you have a professional Instagram account – which any business should have. Instagram Insights include a seven-day overview of:
- Accounts Reached
- Content Interactions
- Total Followers
You will also be able to see the percentage increase or decrease for the above.
You can then see additional insights broken down by post, story or Instagram TV (IGTV). These include Comments, Impressions, Likes, Profile Visits, Saves, Shares and Button Taps.


Twitter Analytics will initially show a twenty-eight day summary of your latest:
- Tweets
- Tweet Impressions
- Profile Visits
- Mentions
- Followers
You will also be able to see the percentage increase or decrease for the above.
Below this, you will see your results broken down month by month including your Top Tweet, Top Mention, Top Follower and Top Media Tweet. For additional insight click ‘View All Tweet Activity’ so you can review your engagement and impressions by post.

Bite-Size Chunks
Paralysis by analysis is real, so you must identify your most important measures of success for you as a business and look at this data initially. Otherwise, you will find yourself trying to understand the significance of several metrics across multiple Social Media platforms and ultimately end up in a muddle without a precise measure of success.
Key metrics may differ from business to business, but as a starting point, it’s vital you monitor your reach and engagement. These metrics will tell you whether the Social Media platform rates your content (which will lead them to show it more often and therefore increasing your reach) and whether your audience is liking what they see also.
Reach
The reason measuring your reach on Social Media is so important is quite simply because the higher your reach, the higher your opportunity to engage with and, ultimately, convert your audience. Each business will have a different objective on Social Media, whether it’s to increase sales or improve their brand reputation. However, no goals will be met until your reach is significant enough to make an impact.
Engagement
The way Social Media algorithms work is they show the content they think their users will want to see as a priority. Reach and engagement almost work hand in hand as the more engagement your content receives, the more the platforms know to show your posts to others. At the same time, the more people who see your updates, the more opportunities you have for engagement.
Benchmarking
Benchmarking is the practice of comparing something to a set standard. Your benchmarks could be industry standards or, in a more niche market, you own. If you measure your Social Media results month on month, you will eventually be able to plot any trends and compare these to industry level standards. Identifying which content your audience responds to the best, whether it drove lots of traffic to your website or had high levels of engagement, will help you plan your future content.
Website Traffic
Even if you’re not actively looking to drive traffic to your website, you should ensure any links you include in your Social Media updates are trackable. Trackable links mean that you can measure the result of both your paid and organic content. By having trackable links in your updates, you can also monitor what your audience does when they arrive on your website. If they drop off straight away, then it might be time to revisit some of your website pages and make sure they are suitable, easy to understand and mobile-friendly. Improving your website could also help with your search engine optimisation (SEO).


